

Reading Your Dashboard
Today's pace, exceptions, inventory health, SLA performance, inbound, and shipped trends — what each panel means and how to act on it.
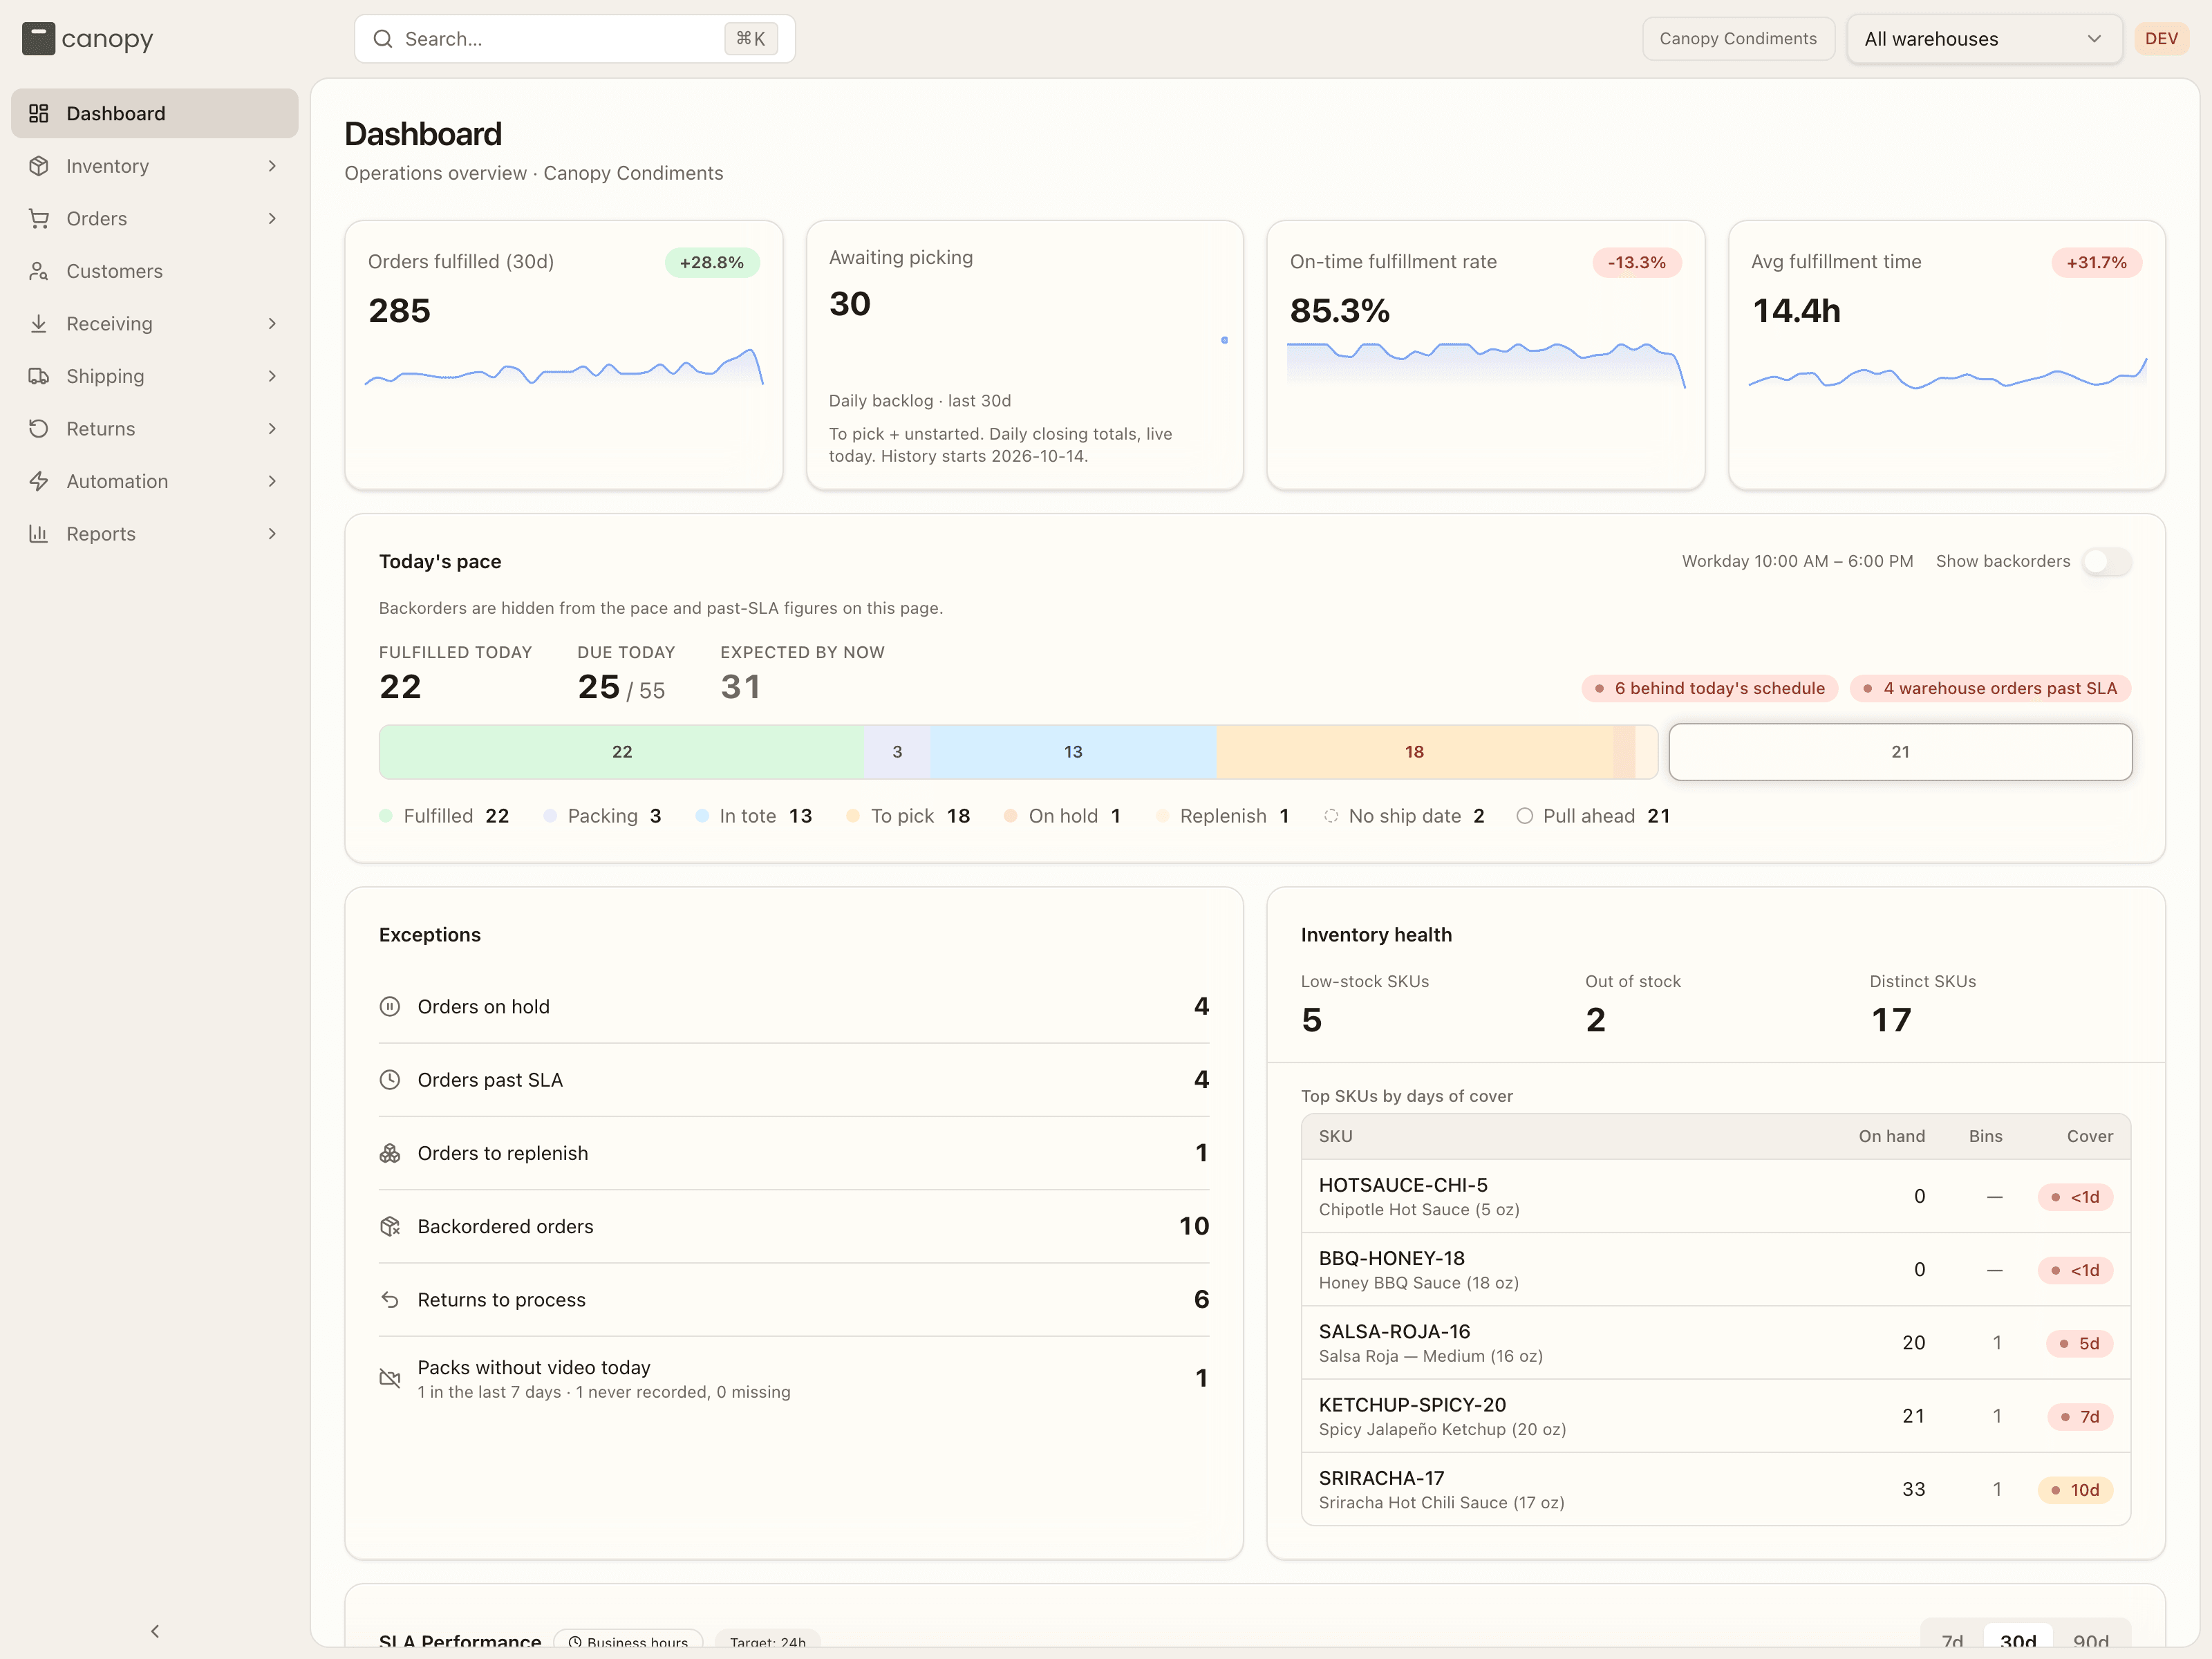
The Dashboard is the first screen you see, and the one that answers the question you actually care about: is everything on track today? Everything on it is scoped to your brand and updates as the warehouse works through your orders.
Time range
The panels that show trends use a time range you can switch between 7, 30, and 90 days (top right of the SLA panel). The selection is saved in the page URL, so you can bookmark or share a specific view.
The KPI tiles
The four tiles across the top are your headline numbers, each with a sparkline. Three carry a trend badge comparing the last 7 days to the 7 before. Awaiting picking plots the combined To pick + Unstarted backlog at the end of each day, with today's live total as the latest point. History starts on the date shown below the plot. Earlier days are unavailable, not zero. The tile links to the orders currently waiting.
| Tile | What it tells you |
|---|---|
| Orders fulfilled | How many orders have shipped over the window (the label shows the selected range, e.g. Orders fulfilled (30d)). The sparkline shows daily volume. |
| Awaiting picking | Orders waiting for a picker (Allocated) plus orders not yet allocated (Pending). Click the tile to see both. Replenishment, held orders, and backorders are excluded. The plot shows whether this backlog is growing or shrinking over time. |
| On-time fulfillment rate | The share of orders shipped within your SLA target. |
| Avg fulfillment time | How long, on average, an order takes from received to packed — measured in business hours. |
Where a number here is labelled orders, it counts your order as your store does: an order your 3PL split across warehouses counts once, is fulfilled on the day its last warehouse's order packs, and is past SLA when any of them is. Today's pace counts the orders each warehouse works on, and says so.
On Avg fulfillment time, a lower number is better, so a downward trend shows as a positive (green) badge.
Packs without video
If your 3PL records its pack benches, the Exceptions panel shows a line, Packs without video today: how many of your packs completed today have no clip, with the last seven days in small text under it. Click it to see those packs on Pack Videos. The line only appears once your 3PL has paired a camera.
Today's pace
This panel breaks down all of your open work — anything overdue, due today, or carrying no ship date — into the stages of fulfillment, so you can see at a glance how much of today's work is done and how much is still in flight. Orders dated after today sit apart in an outlined Pull ahead block: available to start early, but not yet committed.

| Stage | Meaning |
|---|---|
| Fulfilled | Packed and handed off today — done for the day. |
| Packing | At a pack station now. |
| In tote | Picked and waiting to be packed. |
| To pick | Allocated and queued for picking. |
| On hold | Held for review — release the hold to let it move. |
| Replenish | Stock is reserved for the order, but it isn't all in a pickable bin yet — the warehouse tops the pick face up, or ships it from overstock. |
| Backordered | Waiting for stock to arrive. |
| Needs attention | Unfulfillable, or partially shipped with the remainder still owed. |
| Unstarted | Pending and not yet allocated — overdue ones are called out in red. |
The legend under the bar repeats each stage with its count. When any open order has no required ship date, a dashed No ship date entry joins it — those orders are already counted inside the stages above (an undated order in a tote is still in a tote), so it's a cross-cutting tag rather than a band of its own. Set a ship date on them and they sort themselves into a deadline.
Show backorders in the panel header decides whether orders waiting for stock count here. It starts off — a note under the title says "Backorders are hidden from the pace and past-SLA figures on this page" — so the pace, the past SLA pill and the Exceptions panel's Orders past SLA row describe only work the warehouse can act on; turn it on to include backorders in all three. The Exceptions panel's Backordered orders row lists them either way. The setting lives in the page URL, so a bookmarked dashboard keeps it.
If any orders are past their required ship date, a red pill in the panel header flags how many: N warehouse orders past SLA. When there's nothing due, you'll see "Nothing due today". If nothing is open at all and nothing is queued for a later date, the panel shows "Nothing open" instead of a bar, or "No matching warehouse orders" while backorders are hidden.
The panel counts the orders each warehouse is working on. If your order is ever split across two warehouses, it counts once in each.
Exceptions
The Exceptions panel surfaces the handful of things that need your attention — and only the things you can act on:
| Exception | What it means | Where it takes you |
|---|---|---|
| Orders on hold | Orders paused for a reason like payment or address verification. | Orders, filtered to on-hold |
| Orders past SLA | Open orders that have missed their required ship date. | Orders, filtered to past-SLA |
| Orders to replenish | Orders whose stock is reserved but not yet in a pickable bin — waiting on the warehouse to move it. | Orders, filtered to replenish |
| Backordered orders | Orders waiting on stock that ran out. | Orders, filtered to backordered |
| Returns to process | Every return that isn't Completed or Cancelled — Pending (not yet on its way back), In Transit, Received, and Inspecting. | Returns |
Each row links straight to the filtered list so you can act on it. When nothing needs attention, the panel reads "No active exceptions".
Warehouse-floor exceptions — low-stock pick bins, replenishment tasks, tote issues — are your 3PL's concern and don't appear on your account. You see the order- and return-level exceptions that are yours to resolve. Orders to replenish is the one that is yours: it counts your orders held up by that work, not the bin tasks behind it.
Inventory health
A fast read on which products are running low, based on days of cover — how long current stock will last at your recent sales velocity.
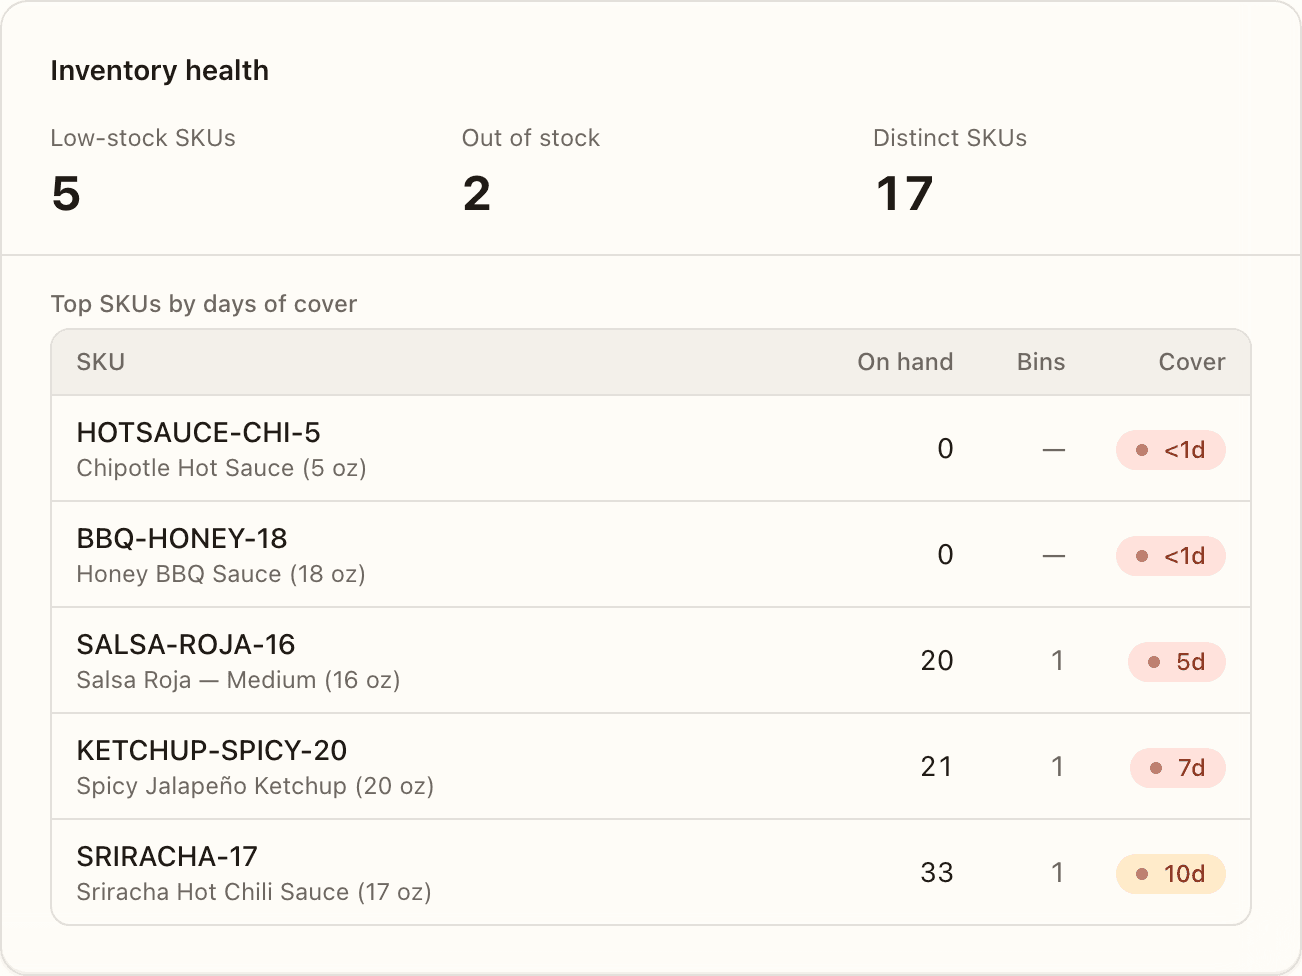
The three counters at the top:
- Low-stock SKUs — products with less than 14 days of cover.
- Out of stock — products selling but with zero sellable stock on hand.
- Distinct SKUs — how many products you hold stock for.
Below, a table headed Top SKUs by days of cover ranks your low-stock SKUs with the least runway first — each with its On hand total, how many Bins hold it (a dash when none), and a Cover pill. When nothing is low, the heading changes to Lowest days of cover with the note "All SKUs are healthy — these have the least runway at current velocity" — a watch-list rather than a blank panel. Days of cover is color-coded so you can triage at a glance:
| Color | Days of cover | Read it as |
|---|---|---|
| 🔴 Red | under 7 (<1d when less than a day) | Reorder now |
| 🟡 Amber | 7 to under 14 | Reorder soon |
| 🟢 Green | 14 or more | Healthy |
A dash (—) means there's stock but no recent sales, so there's no velocity to project from. If nothing has shipped in the selected window, the panel reads "No velocity yet". A SKU your 3PL merged into another drops off the list, and the units it sold count toward the SKU it was merged into.
Lots and sellable stock
For lot-tracked products (like a fermented hot sauce with an expiry date), days of cover counts only sellable stock. Stock on an expired, short-dated, on-hold, or recalled lot is excluded — so a low number reflects what you can actually ship. See the Inventory guide for how lots work.
SLA Performance
Where the On-time fulfillment rate tile is the headline, this panel shows the distribution behind it:
- On-time — the same rate as the tile, for the selected range.
- Median ship time — the typical order's fulfillment time, in business hours.
- P90 ship time — 90% of orders ship faster than this; your worst-case read.
Below the stats, the orders that actually breached SLA are listed so you can see which orders, not just the percentage.
Inbound this week
A quick look at inbound stock:
- Expected today — purchase orders arriving today.
- Pending shipments — open POs created but not yet started.
- In progress — POs the warehouse is actively receiving.
Only Expected today is date-bounded; Pending and In progress count all your open inbound POs. Manage them in the Receiving section.
Fulfilled over time
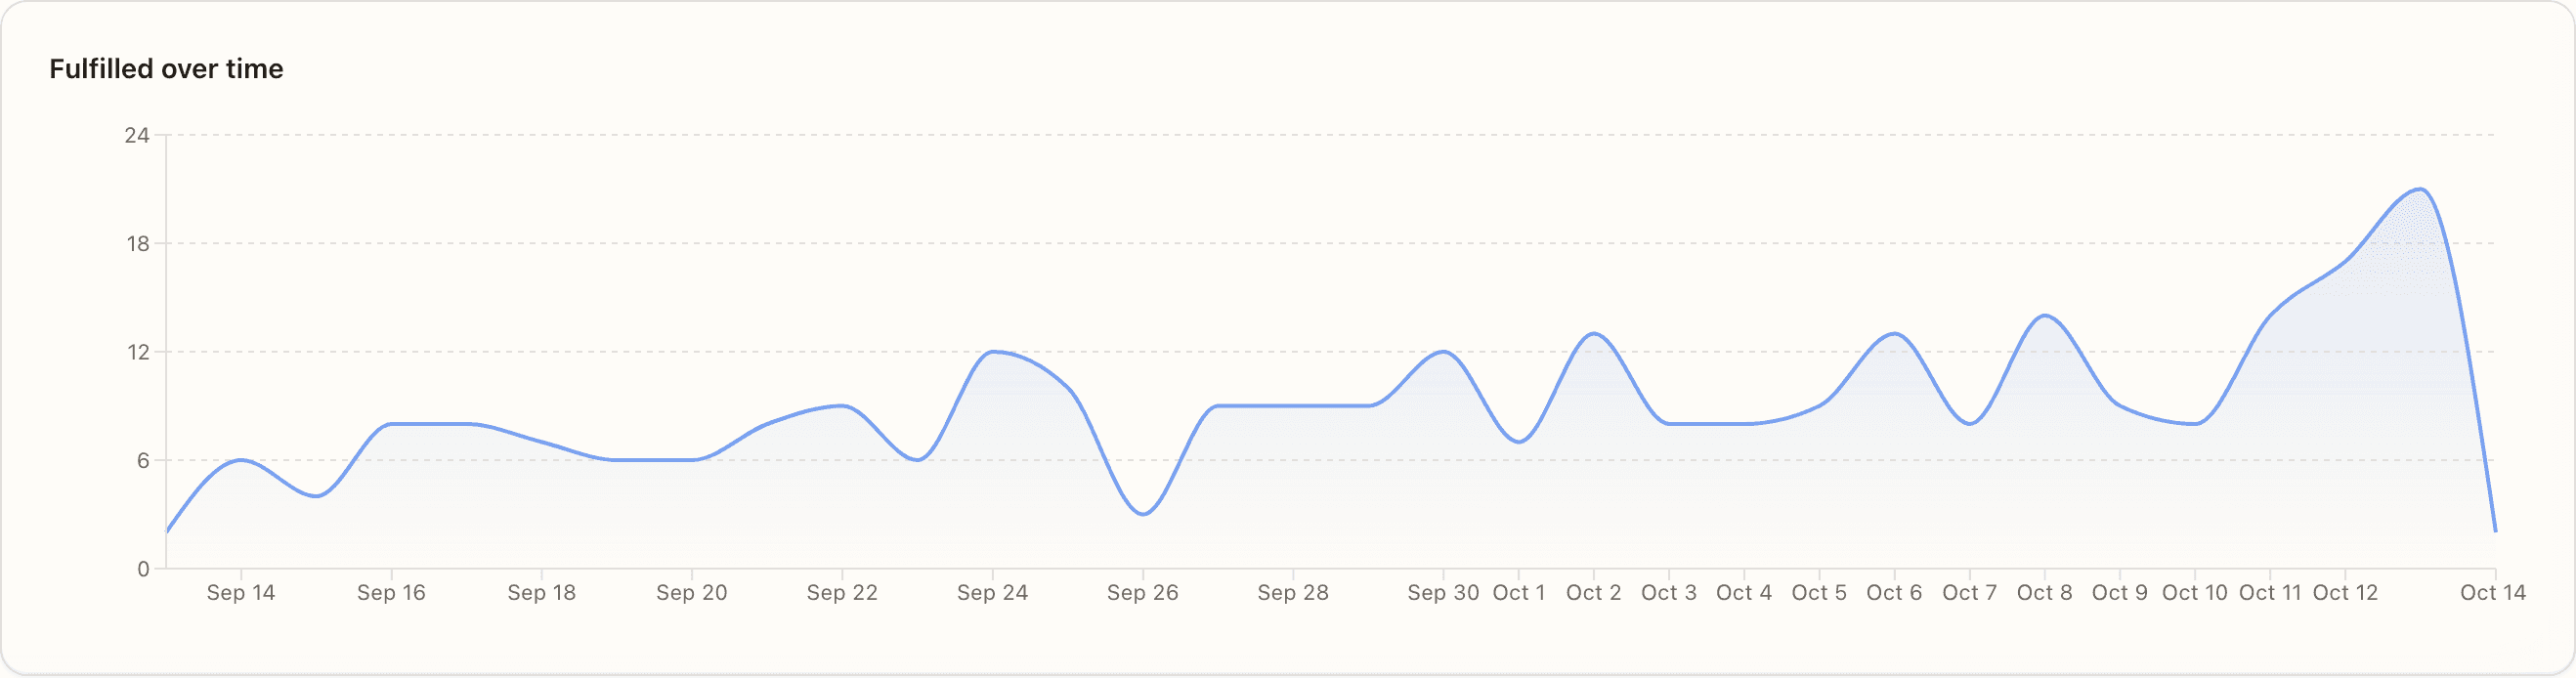
The chart at the bottom (titled Fulfilled over time) plots orders fulfilled per day across the selected range, so you can spot weekly rhythm and longer-term growth.
Next
That's the whole dashboard. From here, drill into any number by clicking through to its section — most panels link straight to the filtered list behind the count.